Links on the IntelliJ site:
- 1. The main documentation page
- 2. Demos and tutorials including a couple of new Groovy support demonstrations
- 3. 25 things you can do with IntelliJ 8 you can’t do with 7
- 4. Mac Keymap reference
- 5. Windows/Linux keymap reference
- 6. The Jetbrains IntelliJ blog. A great way of getting tips from the guys that wrote it, and keeping up to date with improvements.
DZone: Intellij in 7 pages
My personal faves
- 8. Command Shift-A to bring up a search window for actions. This one I think of as Quicksilver for my IDE.
- 9. Alt-Enter to trigger intentions. Problem with your code? Let the IDE suggest a refactor to correct it.
- 10. Ctrl-n for auto-generation of Java code. Getter and setter boilerplate getting you down(and you can’t switch from Java to Groovy)? Want a nice compact toString() on a class with 20 member variables? Let the IDE do the heavy lifting.
- 11. The Javadoc Sync plugin. This goes well with #10 to javadoc all those getters and setters auto-magically.
Add logging using the debugger
- 12. Printing to the console is a basic tool for
debugging code. Everybody’s done it – because it’s easy and it works.
But you often come across scenarios that disallow this quick and
satisfying hackish behaviour. Namely when you are debugging into code in
a library, this is not necessarily an easy option. Fortunately IntelliJ
provides a nice easy way to add console logging through the debugger.
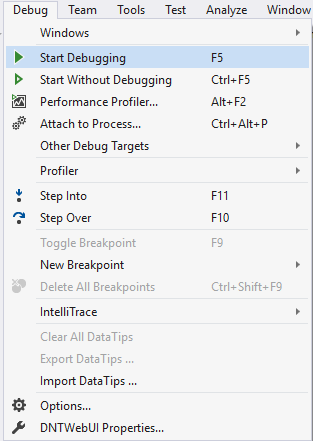
You can access the breakpoint configuration dialog either by right
clicking on an existing line breakpoint and selecting ‘Properties’ or by
pressing Command Shift-F8 from the Debug view. From there you configure
your line or Exception breakpoint with a ‘Suspend policy’ of ‘None’ and
check the boxes under ‘Actions’ to enable logging. A full description
of the features can be found here.
I find this especially handy when there’s a problem iterating over a
Collection and only one or some of the items in that Collection lead to
an error condition during processing. Using this strategy I can provide
context as to which cases passed and which failed without having to
stop at a bunch of breakpoints and inspect the variables on the stack; I
can just concentrate on the failure point and look back at the console
output to compare against previous invocations.
Here’s a couple of screencaps to show configuration for logging the size of a list on a line breakpoint. Note that the Groovy requires a little bit of extra magic, since the debugger gets passed a Reference object instead of the raw List.
Resource: http://www.kellyrob99.com/blog/2009/08/18/my-favorite-intellij-resources-tips-and-tricks/
http://www.jetbrains.com/idea/docs/IntelliJIDEA8_ReferenceCard.pdf


No comments:
Post a Comment